The takeaway from this article is that, if you run Jira or Confluence, there is a config tweak you really ought to make, to allow the use of GCViewer to debug any future garbage collection problems:
For Jira, edit
bin/set-gc-params.shand addtags,level:Code Block diff --git a/bin/set-gc-params.sh b/bin/set-gc-params.sh --- a/bin/set-gc-params.sh +++ b/bin/set-gc-params.sh @@ -6,7 +6,7 @@ then # In Java 9, GC logging has been re-implemented using the Unified GC logging framework. # See http://openjdk.java.net/jeps/158 or https://docs.oracle.com/javase/10/jrockit-hotspot/logging.htm - GC_JVM_PARAMETERS="-Xlog:gc*:file=$LOGBASEABS/logs/atlassian-jira-gc-%t.log:time,uptime:filecount=5,filesize=20M ${GC_JVM_PARAMETERS}" + GC_JVM_PARAMETERS="-Xlog:gc*:file=$LOGBASEABS/logs/atlassian-jira-gc-%t.log:time,uptime,tags,level:filecount=5,filesize=20M ${GC_JVM_PARAMETERS}" GC_JVM_PARAMETERS="${GC_JVM_PARAMETERS} ${JVM_GC_ARGS}" else # Set the JVM arguments used to start Jira. For a description of the options, see- For Confluence
What's this all about?
Java garbage collection is not something most people think about much, until one day your Jira server grinds to a halt. If you're luckyyou'll see an OutOfMemoryError in your /opt/atlassian/jira/logs/catalina.out log file, making the diagnosis easy. But more often Jira will just be really slow, high CPU usage, and thread dumps showing a variety of threads doing normal CPU-bound things. In this case your Jira may be GC thrashing: i.e. under memory pressure, and spending most of its time (but not quite enough to trigger an OutOfMemoryError) on garbage collector threads trying to clear up memory.
The best way to diagnose GC thrashing, or any "what the hell is Jira so busy with?" situation, is to use top (or htop or atop ) with threads enabled, so you can see which Java thread(s) are the CPU consumers. I like atop for its ability to rewind and view past states. Here is atop after pressing 'y' to enable threads:
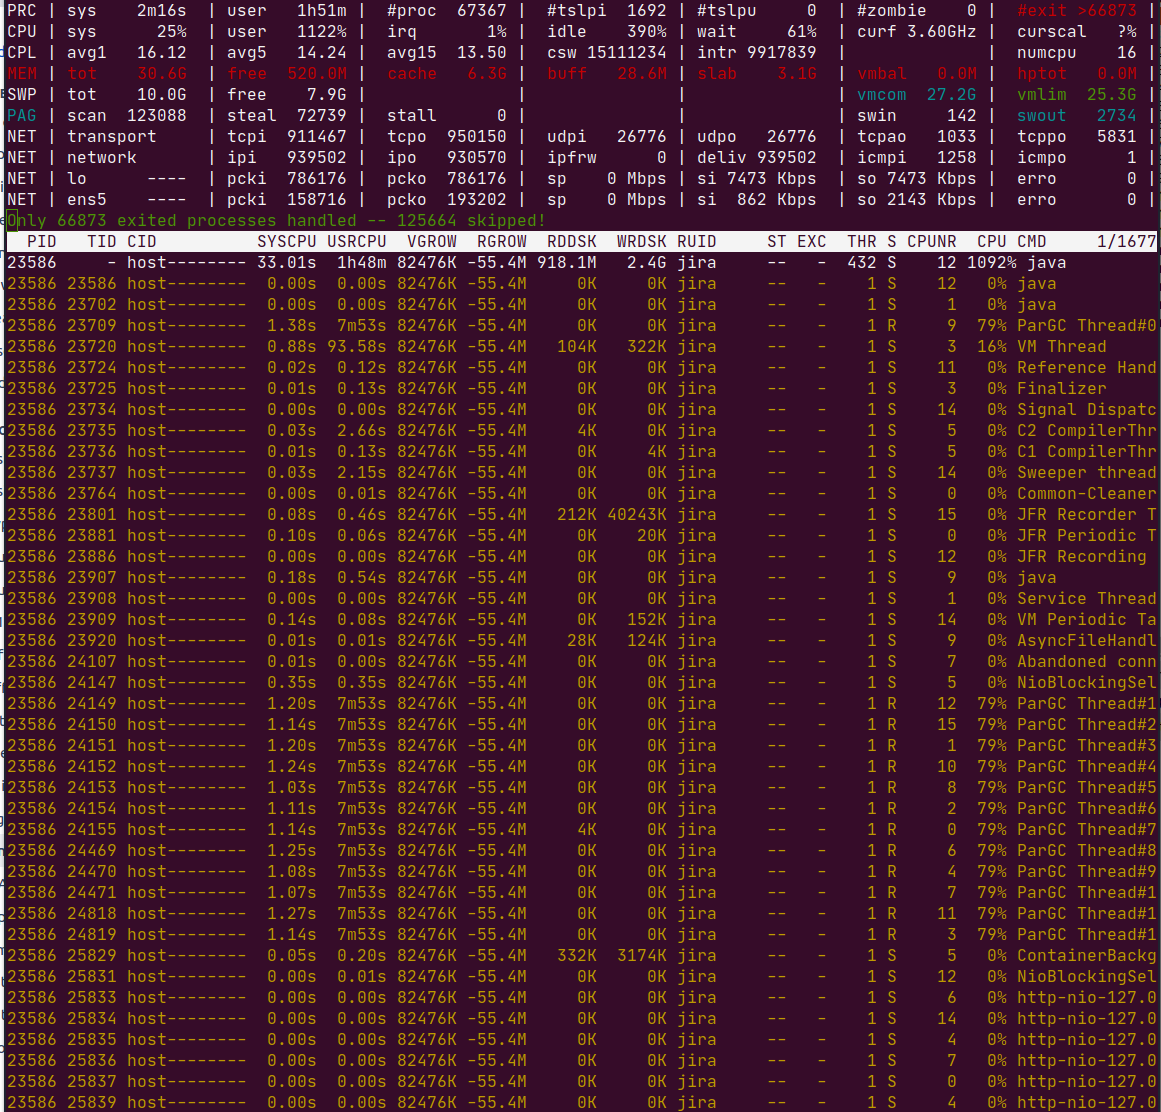
See in the CPU column: Jira is consuming all CPU (1092%), and specifically the only threads active (79% each) are ParGC Thread threads.
GC logs
Out the box, Jira is configured (in bin/set-gc-params.sh ) with these GC configuration parameters:
| Code Block |
|---|
    GC_JVM_PARAMETERS="-Xlog:gc*:file=$LOGBASEABS/logs/atlassian-jira-gc-%t.log:time,uptime:filecount=5,filesize=20M ${GC_JVM_PARAMETERS}"
GC_JVM_PARAMETERS="-XX:+UseParallelGC ${GC_JVM_PARAMETERS}" |
That means you should have a log file, /opt/atlassian/jira/logs/atlassian-jira-log-gc-*.log with GC logs looking like this:
| Code Block |
|---|
[2020-09-22T03:34:05.289-0700][2465737.513s] GC(355175) Pause Full (Ergonomics) 5020M->4521M(5587M) 3608.541ms
[2020-09-22T03:34:05.289-0700][2465737.513s] GC(355175) User=41.39s Sys=0.00s Real=3.60s
[2020-09-22T03:34:05.524-0700][2465737.748s] GC(355176) Pause Full (Ergonomics)
[2020-09-22T03:34:05.524-0700][2465737.748s] GC(355176) Marking Phase
[2020-09-22T03:34:06.432-0700][2465738.656s] GC(355176) Marking Phase 908.653ms
[2020-09-22T03:34:06.432-0700][2465738.656s] GC(355176) Summary Phase
[2020-09-22T03:34:06.432-0700][2465738.657s] GC(355176) Summary Phase 0.074ms
[2020-09-22T03:34:06.432-0700][2465738.657s] GC(355176) Adjust Roots
[2020-09-22T03:34:06.592-0700][2465738.816s] GC(355176) Adjust Roots 159.736ms
[2020-09-22T03:34:06.592-0700][2465738.816s] GC(355176) Compaction Phase
[2020-09-22T03:34:09.213-0700][2465741.437s] GC(355176) Compaction Phase 2620.355ms
[2020-09-22T03:34:09.213-0700][2465741.437s] GC(355176) Post Compact
[2020-09-22T03:34:09.238-0700][2465741.462s] GC(355176) Post Compact 25.488ms
[2020-09-22T03:34:09.238-0700][2465741.462s] GC(355176) PSYoungGen: 957440K->451409K(1527296K)
[2020-09-22T03:34:09.238-0700][2465741.462s] GC(355176) ParOldGen: 4194303K->4194162K(4194304K)
[2020-09-22T03:34:09.238-0700][2465741.462s] GC(355176) Metaspace: 759906K->759906K(1824768K)
[2020-09-22T03:34:09.238-0700][2465741.462s] GC(355176) Pause Full (Ergonomics) 5030M->4536M(5587M) 3714.746ms
[2020-09-22T03:34:09.238-0700][2465741.462s] GC(355176) User=42.65s Sys=0.10s Real=3.71s
[2020-09-22T03:34:09.387-0700][2465741.611s] GC(355177) Pause Full (Ergonomics)
[2020-09-22T03:34:09.387-0700][2465741.611s] GC(355177) Marking Phase
[2020-09-22T03:34:10.306-0700][2465742.531s] GC(355177) Marking Phase 919.544ms
[2020-09-22T03:34:10.306-0700][2465742.531s] GC(355177) Summary Phase
[2020-09-22T03:34:10.307-0700][2465742.531s] GC(355177) Summary Phase 0.078ms
[2020-09-22T03:34:10.307-0700][2465742.531s] GC(355177) Adjust Roots
[2020-09-22T03:34:10.470-0700][2465742.694s] GC(355177) Adjust Roots 163.227ms
[2020-09-22T03:34:10.470-0700][2465742.694s] GC(355177) Compaction Phase
[2020-09-22T03:34:13.473-0700][2465745.698s] GC(355177) Compaction Phase 3003.617ms
[2020-09-22T03:34:13.474-0700][2465745.698s] GC(355177) Post Compact
[2020-09-22T03:34:13.499-0700][2465745.723s] GC(355177) Post Compact 25.643ms
[2020-09-22T03:34:13.499-0700][2465745.723s] GC(355177) PSYoungGen: 957440K->512920K(1527296K)
[2020-09-22T03:34:13.499-0700][2465745.723s] GC(355177) ParOldGen: 4194162K->4194126K(4194304K)
[2020-09-22T03:34:13.499-0700][2465745.723s] GC(355177) Metaspace: 759906K->759906K(1824768K)
[2020-09-22T03:34:13.499-0700][2465745.724s] GC(355177) Pause Full (Ergonomics) 5030M->4596M(5587M) 4112.550ms
[2020-09-22T03:34:13.499-0700][2465745.724s] GC(355177) User=47.24s Sys=0.00s Real=4.11s
[2020-09-22T03:34:13.503-0700][2465745.727s] GC(355178) Pause Full (Ergonomics)
[2020-09-22T03:34:13.503-0700][2465745.727s] GC(355178) Marking Phase
[2020-09-22T03:34:14.417-0700][2465746.641s] GC(355178) Marking Phase 914.147ms
[2020-09-22T03:34:14.417-0700][2465746.641s] GC(355178) Summary Phase
[2020-09-22T03:34:14.417-0700][2465746.641s] GC(355178) Summary Phase 0.066ms
[2020-09-22T03:34:14.417-0700][2465746.641s] GC(355178) Adjust Roots
[2020-09-22T03:34:14.555-0700][2465746.779s] GC(355178) Adjust Roots 138.314ms
[2020-09-22T03:34:14.555-0700][2465746.779s] GC(355178) Compaction Phase
[2020-09-22T03:34:17.136-0700][2465749.361s] GC(355178) Compaction Phase 2581.276ms
[2020-09-22T03:34:17.137-0700][2465749.361s] GC(355178) Post Compact
[2020-09-22T03:34:17.161-0700][2465749.385s] GC(355178) Post Compact 24.319ms
[2020-09-22T03:34:17.161-0700][2465749.385s] GC(355178) PSYoungGen: 513664K->513419K(1527296K)
[2020-09-22T03:34:17.161-0700][2465749.385s] GC(355178) ParOldGen: 4194126K->4194120K(4194304K)
[2020-09-22T03:34:17.161-0700][2465749.385s] GC(355178) Metaspace: 759906K->759906K(1824768K)
[2020-09-22T03:34:17.161-0700][2465749.385s] GC(355178) Pause Full (Ergonomics) 4597M->4597M(5587M) 3658.596ms
[2020-09-22T03:34:17.161-0700][2465749.385s] GC(355178) User=42.50s Sys=0.01s Real=3.66s
[2020-09-22T03:34:17.318-0700][2465749.542s] GC(355179) Pause Full (Ergonomics)
[2020-09-22T03:34:17.318-0700][2465749.542s] GC(355179) Marking Phase
[2020-09-22T03:34:18.222-0700][2465750.446s] GC(355179) Marking Phase 903.470ms
[2020-09-22T03:34:18.222-0700][2465750.446s] GC(355179) Summary Phase
[2020-09-22T03:34:18.222-0700][2465750.446s] GC(355179) Summary Phase 0.074ms
[2020-09-22T03:34:18.222-0700][2465750.446s] GC(355179) Adjust Roots |
This is from a thrashing server. The lines to note are marked Pause Full. e.g.:
| Code Block |
|---|
[2020-09-22T03:34:13.499-0700][2465745.724s] GC(355177) Pause Full (Ergonomics) 5030M->4596M(5587M) 4112.550ms
[2020-09-22T03:34:13.499-0700][2465745.724s] GC(355177) User=47.24s Sys=0.00s Real=4.11s |
These are "full" stop-the-world events, at least for the default UseParallelGC implementation. This full GC took 4.11s, and occurred just 4.26s since the previous full GC. So not much non-GC work is getting done.
I personally find it quite tedious to interpret these GC logs - finding the relevant lines, and doing timestamp math to figure out the intervals. Hence I find atop with threads a much faster means of answering the simple question "is it thrashing?".
Confluence
Confluence (at least 7.1.2 till 7.4.4) defaults to these options:
| Code Block |
|---|
-XX:+IgnoreUnrecognizedVMOptions -Xlog:gc+age=debug:file=$LOGBASEABS/logs/gc-`date +%F_%H-%M-%S`.log::filecount=5,filesize=2M -Xloggc:$LOGBASEABS/logs/gc-`date +%F_%H-%M-%S`.log -XX:+UseGCLogFileRotation -XX:NumberOfGCLogFiles=5 -XX:GCLogFi leSizeGCLogFileSize=2M ${CATALINA_OPTS} |
Per Disruptive Changes to GC Logging in Java 9
...