This weekend I upgraded a Jira instance from one LTS release to the next (8.13.1 to 8.20.1).
Everything appeared to go well, but shortly afterwards users started complaining: Jira is not emailing certain users.
I checked, and sure enough: there's a situation where Jira 8.13.x and all prior releases would email, but Jira 8.20.x will not.
Specifically, this affects users like this one, who are not in a group like jira-users blessed with 'Application access':
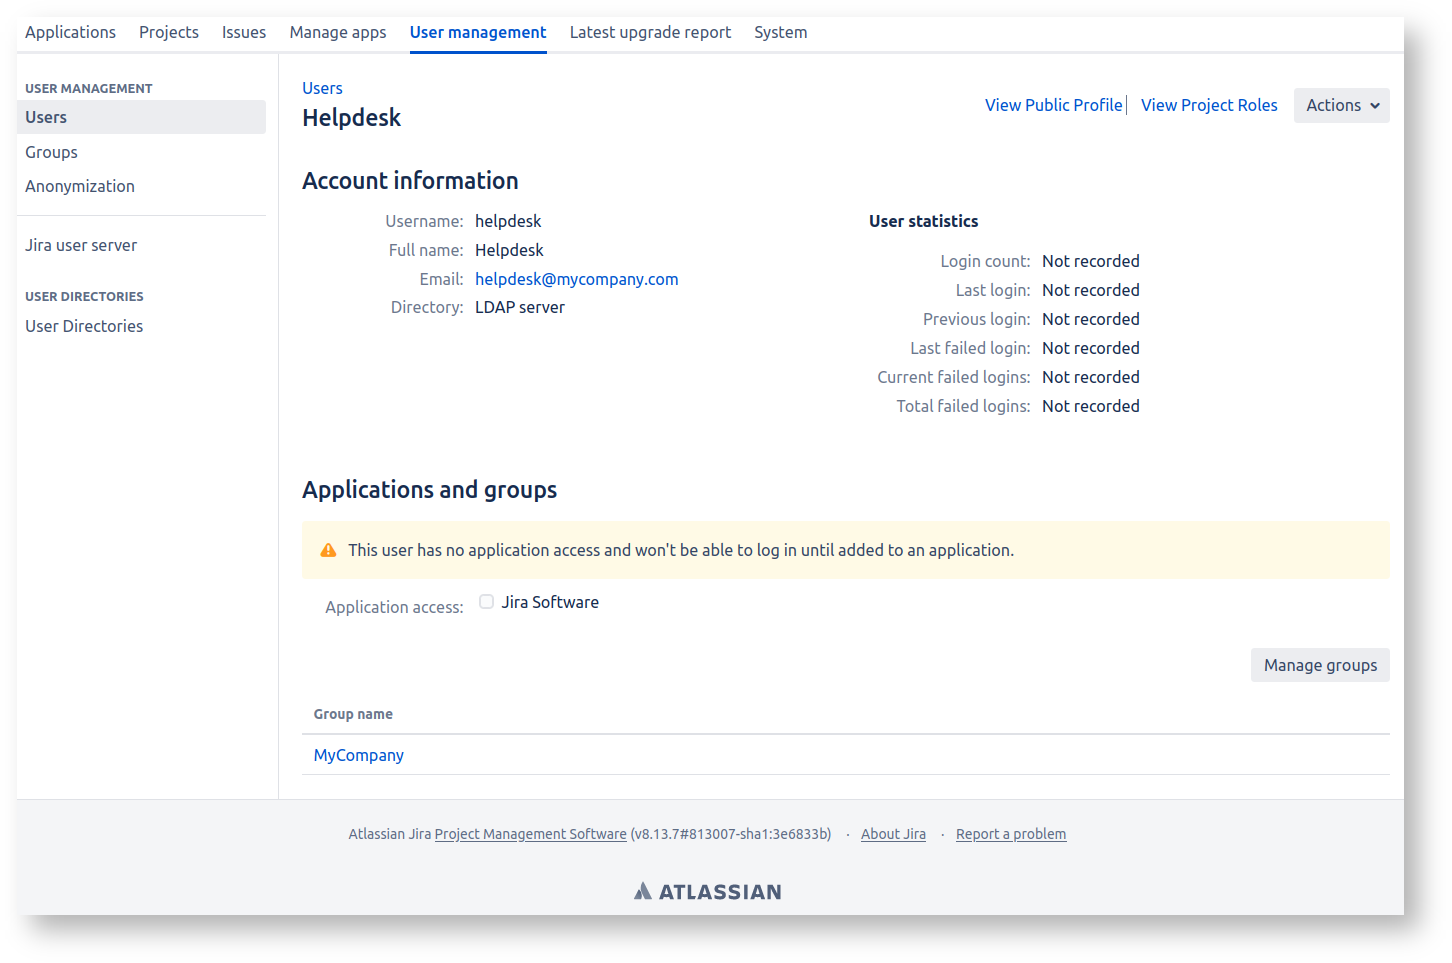
The 'helpdesk' user here is, per Crowdsourcing triage: A useful pattern for Jira issue ownership, an account that never logs in but does get emailed.
What should happen if a new issue is created, assigned to 'helpdesk', or with 'helpdesk' as a watcher?
- In Jira 8.13.x, a notification would go out to
helpdesk@mycompany.com - In Jira 8.20.x no notification goes out.
The 8.20.x behaviour is actually correct. An account without Browse permission shouldn't get emails. Yet this important bug fix is not one of the
Getting issues... fixed between 8.13.1 and 8.20.1 - at least, that I can see.
Anyhow, to know whether your Jira has any user accounts like this, run the following SQL (Postgres-flavoured):
select user_name FROM cwd_user JOIN cwd_membership ON child_id=cwd_user.id JOIN cwd_group ON cwd_group.id=cwd_membership.parent_id WHERE cwd_user.active=1 AND cwd_user.id not in (select child_id from cwd_membership JOIN licenserolesgroup ON licenserolesgroup.group_id=cwd_membership.lower_parent_name);
If you get output, that's bad - those users will stop getting emails in 8.20.x+. Time to fix your group memberships, or bless the group your users are in (here 'MyCompany') with application access.
This page constitutes random notes from my work day as an Atlassian product consultant, put up in the vague hope they might benefit others. Expect rambling, reference to unsolved problems, and plenty of stacktraces. Check the date as any information given is likely to be stale.
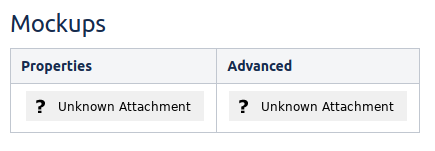
Sometimes Confluence users will report that their attachments have disappeared, with an 'Unknown Attachment' placeholder image showing:
The weird thing is that the attachment(s) do actually exist, attached to the page. It's just the image reference in the page that's broken.
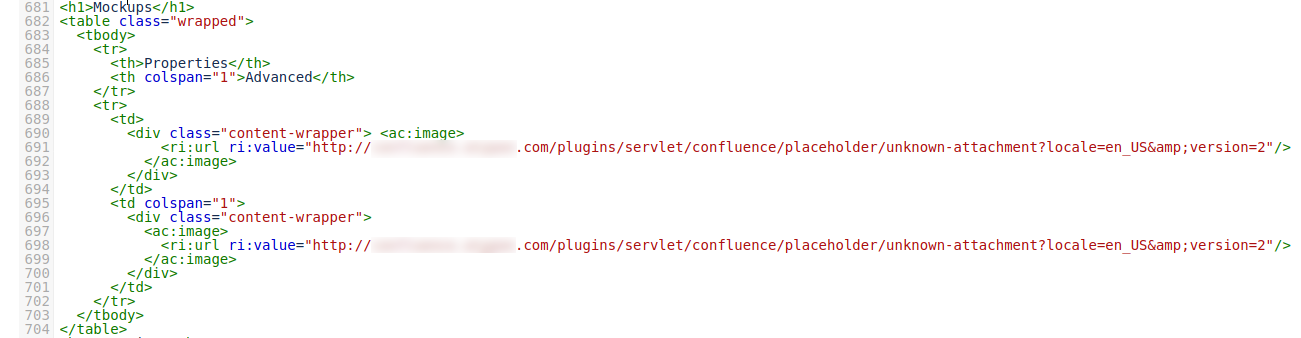
If you view the Confluence page source through the Source Editor plugin, you'll see something weird: the 'Unknown Attachment' isn't Confluence saying "hey, there's no attachment by this name any more". It is in fact an embedded image of the 'unknown-attachment' image:
How does this happen?
This is a result of a bug in the Confluence collaborative editor:
CONFSERVER-55928 - Getting issue details... STATUS
Am I affected?
To see if any of your Confluence's pages are affected by this, run this SQL on the database (Postgres-flavoured):
select 'https://confluence.mycompany.com/pages/viewpage.action?pageId=' || contentid AS url, title, lastmoddate from content JOIN bodycontent USING (contentid) WHERE content_status='current' and prevver is null and body like '%/plugins/servlet/confluence/placeholder/unknown-attachment%';
How to fix?
Since the image attachments are actually there, it's just a matter of editing the page and replacing the 'Unknown Attachment' images with the correct images.
Easier said than done sometimes, especially if the page has been edited many times after the images were corrupted. You'll need to loop tediously through the page history, finding the point at which the image(s) were deleted, then fix the current page's images.
This is exceptionally tedious, but some SQL can help ease the pain:
- First, find the
contentidIDs of affected pages, using the SQL above. Store thecontentidlist in a text file.Now, for each
contentid(for example, 22432553) run this SQL:select baseurl || current AS current , baseurl || bad AS bad , baseurl || good AS good from ( select baseurl , current , contentid AS bad , lastmoddate , lag(contentid, 1) over (order by lastmoddate) AS good , (body ~ 'unknown-attachment') missingattach from (VALUES (22432553)) AS t (current) CROSS JOIN (VALUES ('https://confluence.example.com/pages/viewpage.action?pageId=')) AS b(baseurl) CROSS JOIN content JOIN bodycontent USING (contentid) WHERE content_status='current' and (contentid= current or prevver = current) ORDER BY lastmoddate ) x where missingattach=true limit 1;This will give you three URLs: the current page, the first 'gone bad' revision, and the 'just before we went bad' revision:
confluence=> select baseurl || current AS current , baseurl || bad AS bad , baseurl || good AS good from ( select baseurl , current , contentid AS bad , lastmoddate , lag(contentid, 1) over (order by lastmoddate) AS good , (body ~ 'unknown-attachment') missingattach from (VALUES (22432553)) AS t (current) CROSS JOIN (VALUES ('https://confluence.example.com/pages/viewpage.action?pageId=')) AS b(baseurl) CROSS JOIN content JOIN bodycontent USING (contentid) WHERE content_status='current' and (contentid= current or prevver = current) ORDER BY lastmoddate ) x where missingattach=true limit 1; ┌─[ RECORD 1 ]────────────────────────────────────────────────────────────────────┐ │ current │ https://confluence.example.com/pages/viewpage.action?pageId=22432553 │ │ bad │ https://confluence.example.com/pages/viewpage.action?pageId=101730306 │ │ good │ https://confluence.example.com/pages/viewpage.action?pageId=101729414 │ └─────────┴───────────────────────────────────────────────────────────────────────┘- Now:
- Open all three URLs in three browser tabs
- In the 'bad' tab, locate the 'Unknown Attachment' image and find some identifying text just above it. Perhaps the word Advanced in my example:
- On the 'good' tab search for the marker word. Below it you will see the correct image. Click on the image and note the end part of the URL, which will be the filename. Store the filename in your copy/paste buffer.
- On the 'current' tab:
- edit the page
- Search for your marker word
- Delete the 'Unknown Attachment' image
- Press '!' to begin inserting an image, and paste the image filename from your copy/paste buffer.
- Repeat process for however many broken images you find.
- Save the page.
Still tedious, but not so bad.
The takeaway from this article is that, if you run Jira Server, there is a config tweak you really ought to make, to allow the use of GCViewer to debug any future garbage collection problems:
For Jira, edit /opt/atlassian/jira/bin/set-gc-params.sh and add make this change:
diff --git a/bin/set-gc-params.sh b/bin/set-gc-params.sh
--- a/bin/set-gc-params.sh
+++ b/bin/set-gc-params.sh
@@ -6,7 +6,7 @@
 then
     # In Java 9, GC logging has been re-implemented using the Unified GC logging framework.
     # See http://openjdk.java.net/jeps/158 or https://docs.oracle.com/javase/10/jrockit-hotspot/logging.htm
-    GC_JVM_PARAMETERS="-Xlog:gc*:file=$LOGBASEABS/logs/atlassian-jira-gc-%t.log:time,uptime:filecount=5,filesize=20M ${GC_JVM_PARAMETERS}"
+    GC_JVM_PARAMETERS="-Xlog:gc*:file=$LOGBASEABS/logs/atlassian-jira-gc-%t.log:time,uptime,tags,level:filecount=5,filesize=20M ${GC_JVM_PARAMETERS}"
     GC_JVM_PARAMETERS="${GC_JVM_PARAMETERS} ${JVM_GC_ARGS}"
 else
     # Set the JVM arguments used to start Jira. For a description of the options, see
What's this all about?
Jira is written in Java, which is a "garbage-collected" language. This means that Java programmers don't need to worry about de-allocating memory; the Java virtual machine (JVM) periodically "garbage collects" any memory that is unused.
Garbage collection (GC) happens all the time in a running JVM, and typically takes only milliseconds. However if your JVM is under memory pressure, a full GC can't actually free up that much memory, and soon after another GC is needed, and another.. and you get a situation where the JVM is spending more time GC'ing than doing anything useful. This is called GC thrashing.
If you're lucky you'll see an OutOfMemoryError in your /opt/atlassian/jira/logs/catalina.out log file, making the diagnosis easy. But sometimes Jira will just be really slow, high CPU usage, and thread dumps showing a variety of threads doing normal CPU-bound things. but not quite enough to trigger an OutOfMemoryError) on garbage collector threads trying to clear up memory.
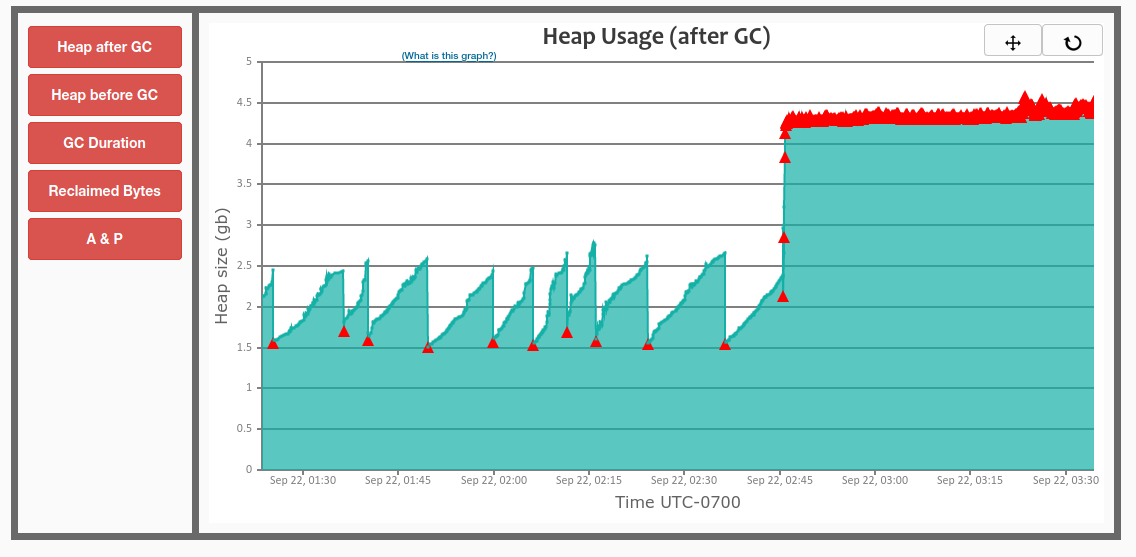
The best way to diagnose GC thrashing, or any "what the hell is Jira so busy with?" situation, is to use top (or htop or atop ) with threads enabled, so you can see which Java thread(s) are the CPU consumers. I like atop for its ability to rewind and view past states. Here is atop after pressing 'y' to enable threads:
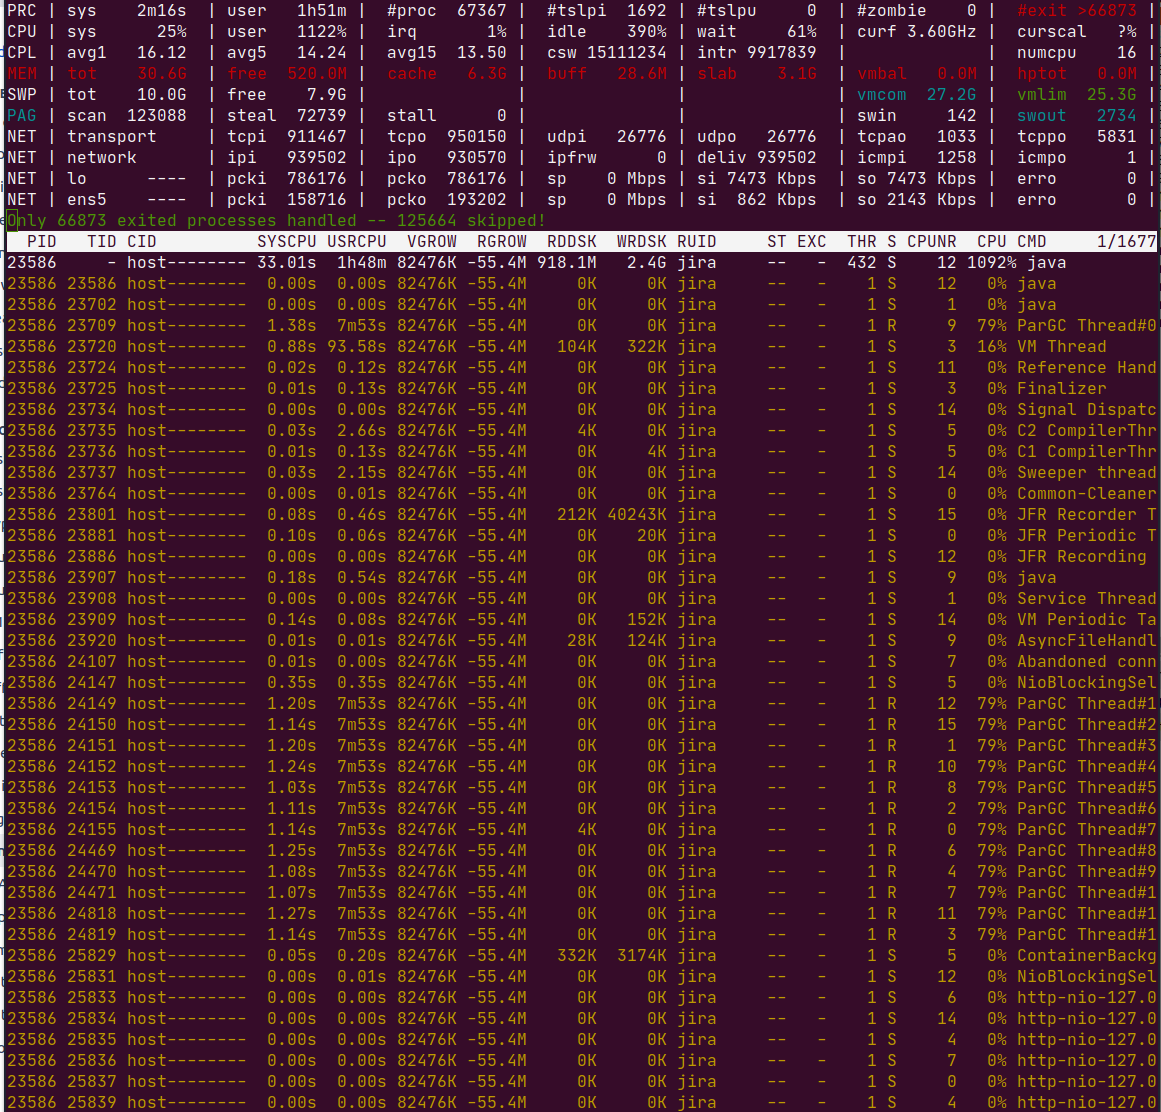
See in the CPU column: Jira is consuming all CPU (1092%), and specifically the only threads active (79% each) are ParGC Thread threads.
GC logs
Out the box, Jira (8.7.1+) is configured with these GC configuration parameters:
# in bin/setenv.sh
JVM_GC_ARGS="-XX:+ExplicitGCInvokesConcurrent"
# in bin/set-gc-params.sh
GC_JVM_PARAMETERS="-Xlog:gc*:file=$LOGBASEABS/logs/atlassian-jira-gc-%t.log:time,uptime:filecount=5,filesize=20M $  {GC_JVM_PARAMETERS}"
GC_JVM_PARAMETERS="${GC_JVM_PARAMETERS} ${JVM_GC_ARGS}"
If you are using Java 9 or above, this means the G1GC algorithm is in use (see Disruptive Changes to GC Logging in Java 9). Earlier versions of Jira used the older Parallel GC (see JRASERVER-64331 - Getting issue details... STATUS ), and look like this:
    GC_JVM_PARAMETERS="-Xlog:gc*:file=$LOGBASEABS/logs/atlassian-jira-gc-%t.log:time,uptime:filecount=5,filesize=20M ${GC_JVM_PARAMETERS}"
    GC_JVM_PARAMETERS="-XX:+UseParallelGC ${GC_JVM_PARAMETERS}"
Either way, you should have a log file, /opt/atlassian/jira/logs/atlassian-jira-log-gc-*.log. GC logs looking something like this:
[2020-09-22T03:34:05.289-0700][2465737.513s] GC(355175) Pause Full (Ergonomics) 5020M->4521M(5587M) 3608.541ms
[2020-09-22T03:34:05.289-0700][2465737.513s] GC(355175) User=41.39s Sys=0.00s Real=3.60s
[2020-09-22T03:34:05.524-0700][2465737.748s] GC(355176) Pause Full (Ergonomics)
[2020-09-22T03:34:05.524-0700][2465737.748s] GC(355176) Marking Phase
[2020-09-22T03:34:06.432-0700][2465738.656s] GC(355176) Marking Phase 908.653ms
[2020-09-22T03:34:06.432-0700][2465738.656s] GC(355176) Summary Phase
[2020-09-22T03:34:06.432-0700][2465738.657s] GC(355176) Summary Phase 0.074ms
[2020-09-22T03:34:06.432-0700][2465738.657s] GC(355176) Adjust Roots
[2020-09-22T03:34:06.592-0700][2465738.816s] GC(355176) Adjust Roots 159.736ms
[2020-09-22T03:34:06.592-0700][2465738.816s] GC(355176) Compaction Phase
[2020-09-22T03:34:09.213-0700][2465741.437s] GC(355176) Compaction Phase 2620.355ms
[2020-09-22T03:34:09.213-0700][2465741.437s] GC(355176) Post Compact
[2020-09-22T03:34:09.238-0700][2465741.462s] GC(355176) Post Compact 25.488ms
[2020-09-22T03:34:09.238-0700][2465741.462s] GC(355176) PSYoungGen: 957440K->451409K(1527296K)
[2020-09-22T03:34:09.238-0700][2465741.462s] GC(355176) ParOldGen: 4194303K->4194162K(4194304K)
[2020-09-22T03:34:09.238-0700][2465741.462s] GC(355176) Metaspace: 759906K->759906K(1824768K)
[2020-09-22T03:34:09.238-0700][2465741.462s] GC(355176) Pause Full (Ergonomics) 5030M->4536M(5587M) 3714.746ms
[2020-09-22T03:34:09.238-0700][2465741.462s] GC(355176) User=42.65s Sys=0.10s Real=3.71s
[2020-09-22T03:34:09.387-0700][2465741.611s] GC(355177) Pause Full (Ergonomics)
[2020-09-22T03:34:09.387-0700][2465741.611s] GC(355177) Marking Phase
[2020-09-22T03:34:10.306-0700][2465742.531s] GC(355177) Marking Phase 919.544ms
[2020-09-22T03:34:10.306-0700][2465742.531s] GC(355177) Summary Phase
[2020-09-22T03:34:10.307-0700][2465742.531s] GC(355177) Summary Phase 0.078ms
[2020-09-22T03:34:10.307-0700][2465742.531s] GC(355177) Adjust Roots
[2020-09-22T03:34:10.470-0700][2465742.694s] GC(355177) Adjust Roots 163.227ms
[2020-09-22T03:34:10.470-0700][2465742.694s] GC(355177) Compaction Phase
[2020-09-22T03:34:13.473-0700][2465745.698s] GC(355177) Compaction Phase 3003.617ms
[2020-09-22T03:34:13.474-0700][2465745.698s] GC(355177) Post Compact
[2020-09-22T03:34:13.499-0700][2465745.723s] GC(355177) Post Compact 25.643ms
[2020-09-22T03:34:13.499-0700][2465745.723s] GC(355177) PSYoungGen: 957440K->512920K(1527296K)
[2020-09-22T03:34:13.499-0700][2465745.723s] GC(355177) ParOldGen: 4194162K->4194126K(4194304K)
[2020-09-22T03:34:13.499-0700][2465745.723s] GC(355177) Metaspace: 759906K->759906K(1824768K)
[2020-09-22T03:34:13.499-0700][2465745.724s] GC(355177) Pause Full (Ergonomics) 5030M->4596M(5587M) 4112.550ms
[2020-09-22T03:34:13.499-0700][2465745.724s] GC(355177) User=47.24s Sys=0.00s Real=4.11s
[2020-09-22T03:34:13.503-0700][2465745.727s] GC(355178) Pause Full (Ergonomics)
[2020-09-22T03:34:13.503-0700][2465745.727s] GC(355178) Marking Phase
[2020-09-22T03:34:14.417-0700][2465746.641s] GC(355178) Marking Phase 914.147ms
[2020-09-22T03:34:14.417-0700][2465746.641s] GC(355178) Summary Phase
[2020-09-22T03:34:14.417-0700][2465746.641s] GC(355178) Summary Phase 0.066ms
[2020-09-22T03:34:14.417-0700][2465746.641s] GC(355178) Adjust Roots
[2020-09-22T03:34:14.555-0700][2465746.779s] GC(355178) Adjust Roots 138.314ms
[2020-09-22T03:34:14.555-0700][2465746.779s] GC(355178) Compaction Phase
[2020-09-22T03:34:17.136-0700][2465749.361s] GC(355178) Compaction Phase 2581.276ms
[2020-09-22T03:34:17.137-0700][2465749.361s] GC(355178) Post Compact
[2020-09-22T03:34:17.161-0700][2465749.385s] GC(355178) Post Compact 24.319ms
[2020-09-22T03:34:17.161-0700][2465749.385s] GC(355178) PSYoungGen: 513664K->513419K(1527296K)
[2020-09-22T03:34:17.161-0700][2465749.385s] GC(355178) ParOldGen: 4194126K->4194120K(4194304K)
[2020-09-22T03:34:17.161-0700][2465749.385s] GC(355178) Metaspace: 759906K->759906K(1824768K)
[2020-09-22T03:34:17.161-0700][2465749.385s] GC(355178) Pause Full (Ergonomics) 4597M->4597M(5587M) 3658.596ms
[2020-09-22T03:34:17.161-0700][2465749.385s] GC(355178) User=42.50s Sys=0.01s Real=3.66s
[2020-09-22T03:34:17.318-0700][2465749.542s] GC(355179) Pause Full (Ergonomics)
[2020-09-22T03:34:17.318-0700][2465749.542s] GC(355179) Marking Phase
[2020-09-22T03:34:18.222-0700][2465750.446s] GC(355179) Marking Phase 903.470ms
[2020-09-22T03:34:18.222-0700][2465750.446s] GC(355179) Summary Phase
[2020-09-22T03:34:18.222-0700][2465750.446s] GC(355179) Summary Phase 0.074ms
[2020-09-22T03:34:18.222-0700][2465750.446s] GC(355179) Adjust Roots
The sample log above is from a thrashing server using the older ParallelGC algorithm. The lines to note are marked Pause Full. e.g.:
[2020-09-22T03:34:09.238-0700][2465741.462s] GC(355176) Pause Full (Ergonomics) 5030M->4536M(5587M) 3714.746ms
.....
[2020-09-22T03:34:13.499-0700][2465745.724s] GC(355177) Pause Full (Ergonomics) 5030M->4596M(5587M) 4112.550ms
[2020-09-22T03:34:13.499-0700][2465745.724s] GC(355177) User=47.24s Sys=0.00s Real=4.11s
By subtracting the timestamps we see a 4.26s interval between full GCs (2465745.724 - 2465741.462), of which the GC occcupied 4.11s. This is what thrashing looks like.
Interpreting GC log files is exceptionally tedious - finding relevant lines, doing timestamp math, etc. If you did want to further analyze this GC log file, what tools could you use?
GCViewer
My tool of choice is GCViewer, because it has been around forever and does the job.
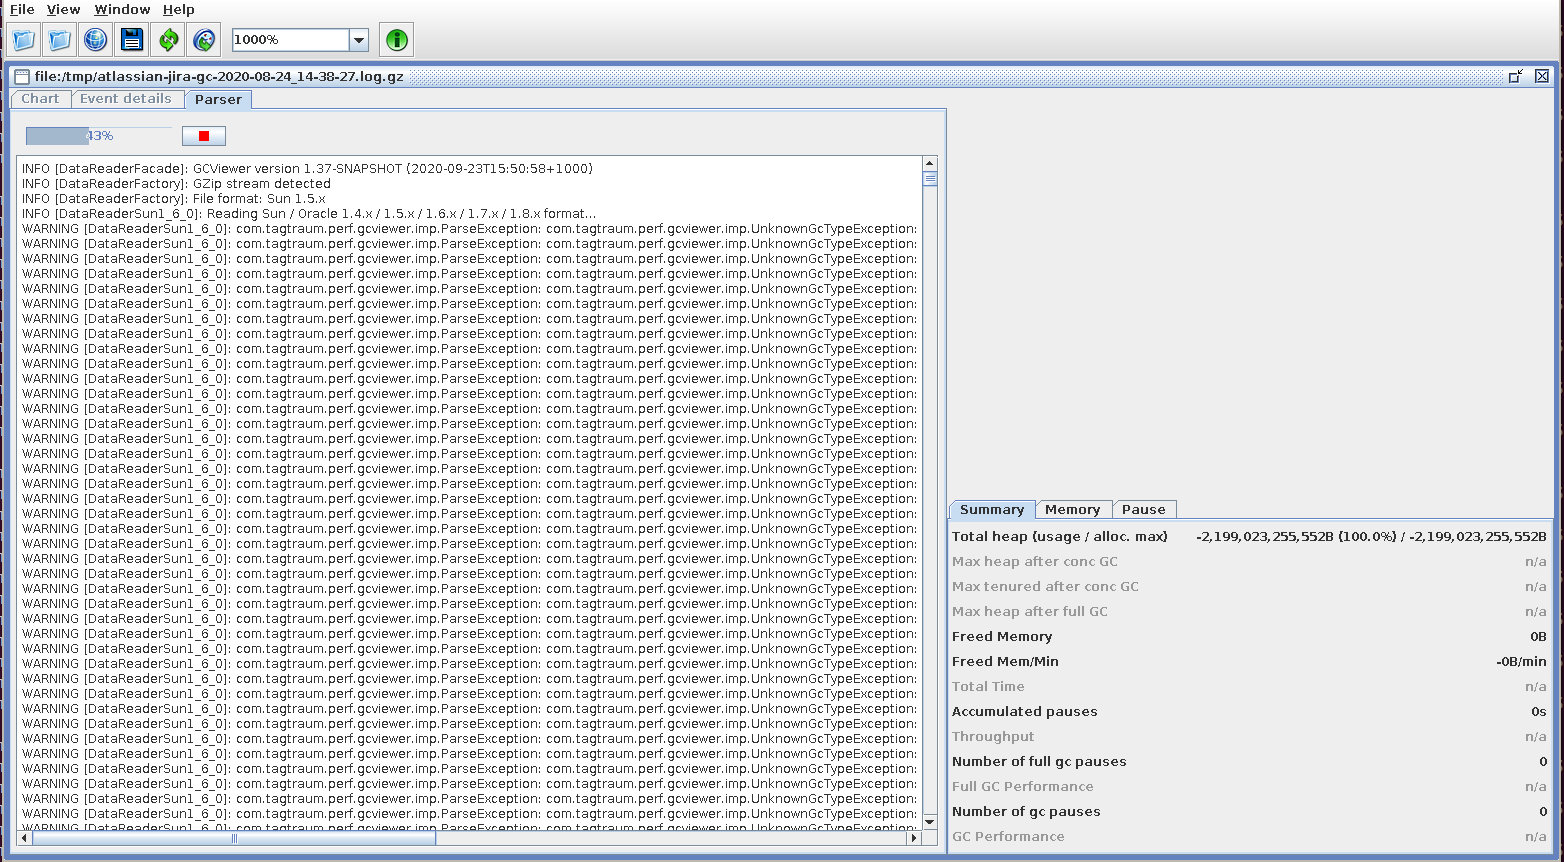
The problem alluded to in the introduction is that GCViewer cannot read the default format of GC logs generated by Jira and Confluence, when using Java 9+. You'll just get an error for each line parsed:
WARNING [DataReaderSun1_6_0]: com.tagtraum.perf.gcviewer.imp.ParseException: com.tagtraum.perf.gcviewer.imp.UnknownGcTypeException: Unknown gc type: '-' Line 1: [2020-09-19T22:16:23.955-0700][2273876.179s] GC(326262) ParOldGen: 2230694K->2232246K(2380800K)
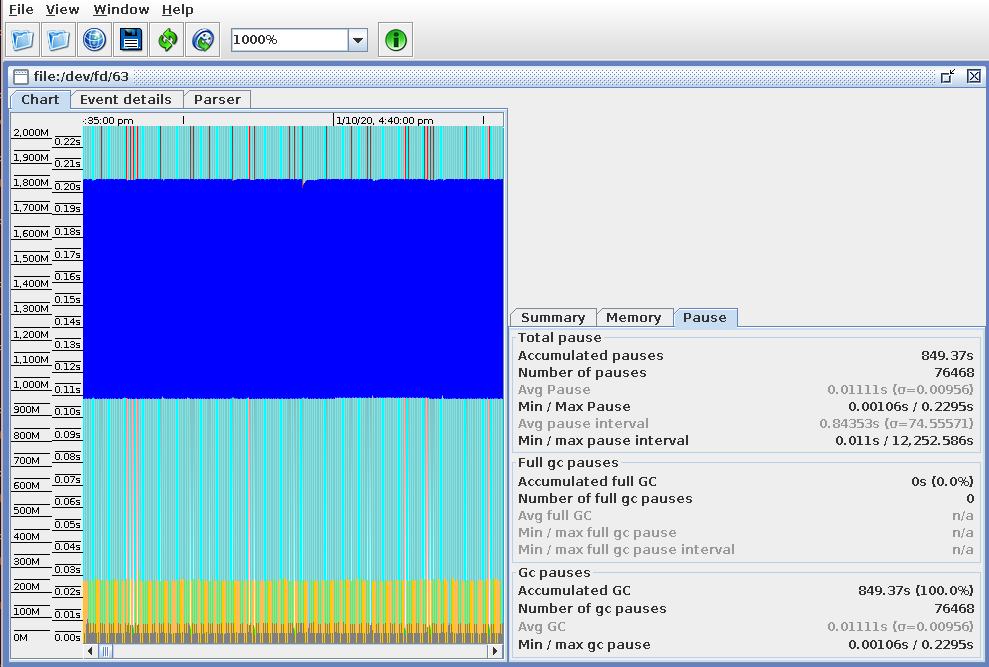
After making the -Xlog:gc tweak suggested in the intro, and restarting Jira, GCViewer should be able to load the /opt/atlassian/jira/logs/atlassian-jira-gc-*.log files:
(example from a perfectly healthy server, sorry)
GCEasy.io
Discovered after reading these GC tuning tips; https://gceasy.io is likely worth the $10/mo. Unlike GCViewer, no -Xlog:gc tweaks are needed. The free tier is enough to give a general idea of GC activity: